
NOAA and its partners have released the latest Regional Climate Impacts and Outlooks, which recap winter conditions and provide insight into what might be expected this spring.
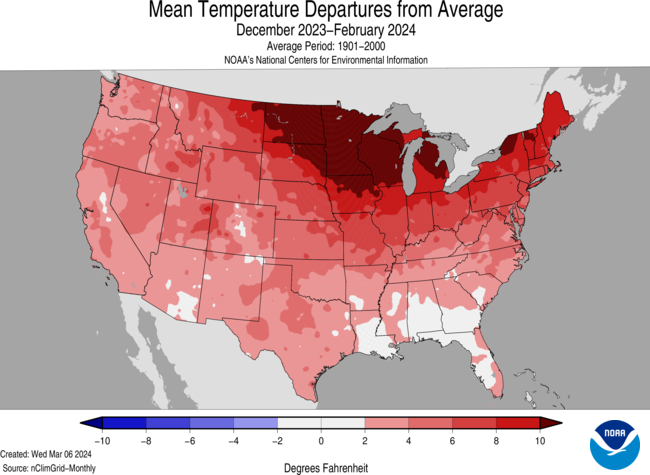
Winter Temperature Recap
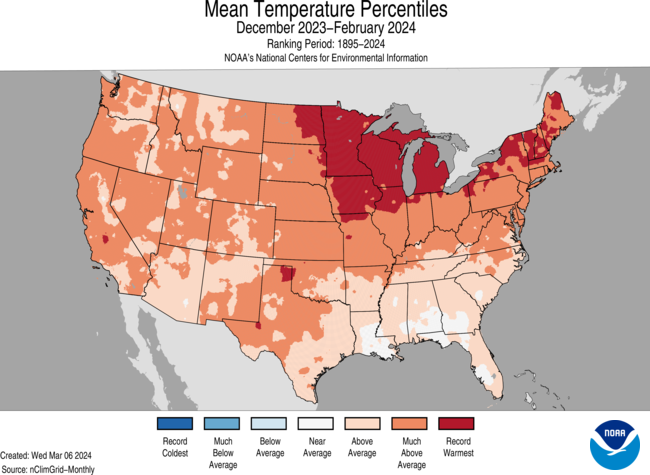
The meteorological winter (December-February) average temperature for the contiguous U.S. was 37.6°F, 5.4°F above average, ranking warmest on record. Temperatures were above average across almost all of the contiguous U.S. and near average only along parts of the Gulf of Mexico and South Carolina. North Dakota, Minnesota, Iowa, Wisconsin, Michigan, New York, Vermont, and New Hampshire each ranked warmest on record, while an additional 26 states ranked among their top-10 warmest winters on record for this period.
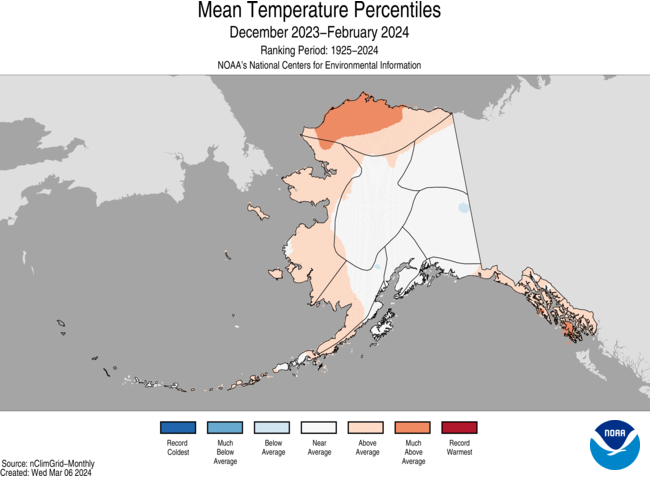
The Alaska winter temperature was 6.4°F, 2.8°F above the long-term average, ranking in the middle third of the historical record for the state. Temperatures were above average across parts of the North Slope, West Coast, Southwest, and Panhandle, while much of the Interior and south-central Alaska were near average for the season.
For the December 2023–February 2024 period, above-normal rainfall was observed across American Samoa, while drier-than normal conditions prevailed across much of the Federated States of Micronesia (FSM), Republic of the Marshall Islands (RMI), Mariana Islands, and the Hawaiian Islands.
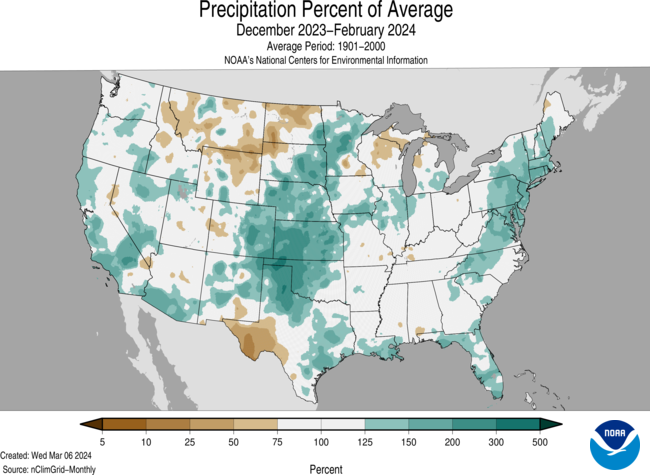
Winter Precipitation Recap
The contiguous U.S. winter precipitation total was 7.71 inches, 0.92 inch above average, ranking in the wettest third of the December 2023–February 2024 record. Precipitation was above average across much of the contiguous U.S., while Connecticut and Delaware each had their third-wettest winter season on record. Winter precipitation was below average along the Northern Tier and in parts of the Great Lakes and Southwest, and in small pockets of the Mississippi Valley and Maine. No state ranked among their top-10 driest winter seasons on record.
Winter precipitation ranked in the wettest third of the historical record for Alaska. Wetter-than-average conditions were observed across much of the state, while near-average precipitation was observed in portions of the central Interior, south-central Interior, northeast Interior, and in parts of the Aleutians.
Spring Temperature Outlook
The April–June 2024 temperature outlook favors above-normal seasonal average temperatures for most of the U.S. with the exception of some areas of the Southwest U.S. and the northern and central High Plains. The greatest odds of above-normal temperatures are for parts of the Pacific Northwest, northwest Alaska, and the Great Lakes region. The April–June outlook does not highlight any favored areas for below-normal seasonal average temperatures.
For Alaska, the transition from El Niño to favorable La Niña conditions resulted in decreasing odds for above-normal temperatures from the west to east through July–September 2024, with the introduction of favorable below-normal temperatures for the southwest part of the state.
The NCEP Climate Forecast System (CFS) and other climate models favor above-normal temperatures for Kauai, Oahu and Maui, while Equal Chances (EC) for above, near or below normal temperatures are forecast for the Big Island in April 2024.
Spring Precipitation Outlook
The April–June 2024 precipitation outlook favors above-normal seasonal total precipitation amounts for the Southeast, lower Ohio Valley, mid-Atlantic, and parts of the central and northern High Plains. Below-normal precipitation is favored for parts of the Pacific Northwest with elevated odds for below-normal precipitation for areas in the Southwest.
Impacts and Outlooks for Your Region
Get more details for your region in the March 2024 climate impacts and outlooks summaries:
- Alaska and Northwestern Canada Region
- Great Lakes Region
- Gulf Coast Region
- Gulf of Maine Region
- Mid-Atlantic Region (coming soon)
- Midwest Region
- Missouri River Basin Region
- Prairies and High Plains Region
- Northeast Region
- Pacific Region
- Southeast Region
- Southern Region
- Western Region
Creating These Quarterly Summaries
NOAA’s Regional Climate Services lead the production of these quarterly summaries of climate impacts and outlooks for various regions of the United States as well as parts of Canada along the border. This effort, which began in 2012, includes 13 unique regional products that are produced collaboratively with partner organizations.
You can access all of the Climate Impacts and Outlooks summaries as well as additional reports and assessments through the U.S. Drought Portal Reports web page at Drought.gov.


