Issued 13 September 2024


Please note that the values presented in this report are based on preliminary data. They will change when the final data are processed, but will not be replaced on these pages.
National Drought Highlights
- Based on the Palmer Drought Index, severe to extreme drought affected about 8% of the contiguous United States as of the end of August 2024, an increase of about 2% from last month. About 9% of the contiguous U.S. fell in the severely to extremely wet categories.
- About 22% of the contiguous U.S. fell in the moderate to extreme drought categories (based on the Palmer Drought Index) at the end of August.
- On a broad scale, the 1980s and 1990s were characterized by unusual wetness with short periods of extensive droughts, the 1930s and 1950s were characterized by prolonged periods of extensive droughts with little wetness, and the first two decades of the 2000s saw extensive drought and extensive wetness (moderate to extreme drought graphic, severe to extreme drought graphic).
- A file containing the national monthly percent area severely dry and wet from 1900 to present is available for the severe to extreme and moderate to extreme categories.
- Historical temperature, precipitation, and Palmer drought data from 1895 to present for climate divisions, states, and regions in the contiguous U.S. are available at the Climate Division: Temperature-Precipitation-Drought Data page. These filenames begin with "climdiv".
- According to the weekly U.S. Drought Monitor (USDM), as of September 03, 2024, 29.95% of the contiguous U.S. (CONUS) (25.24% of the U.S. including Alaska, Hawaii, and Puerto Rico) was classified as experiencing moderate to exceptional (D1-D4) drought.
Detailed Drought Overview
The upper-level atmospheric circulation over North America during August 2024 was characterized by high pressure ridging across much of the CONUS, especially in the southern Plains. The ridge was responsible for above-normal monthly temperatures across the southern tier states and a drier-than-normal month from the Southwest to central Gulf of Mexico states and northward into the Ohio Valley. Some parts of Texas, New Mexico, and Florida had record warm monthly temperatures, and record dryness occurred in areas from the Southwest to southern Plains and Lower Mississippi Valley to central Appalachians. Daily high temperatures were 90 degrees F or warmer every day of the month in parts of Texas and 100 degrees or warmer in parts of the Desert Southwest. The relentless heat increased evapotranspiration which exacerbated the drought conditions.
Pacific Weather systems (short-wave troughs and closed lows) moved through the jet stream flow but kept mostly across the northern states and southern Canada. Sometimes they would punch into the southern ridge, sending cold fronts and surface lows southward across the Plains and eastern CONUS and occasionally into the West. These weather systems gave the Pacific Northwest coast and central to northern Rockies a wetter-than-normal month and triggered showers and thunderstorms that brought above-normal precipitation to parts of the central and northern Plains and Upper Midwest. The cold fronts also helped keep temperatures near to slightly cooler than normal in parts of the Northwest and northern Plains to East Coast. Early in the month, Hurricane Debby and its remnants spread above-normal precipitation across the East Coast. But the Southwest to parts of the interior Northwest, most of the South, the southern to central Appalachians, and parts of the central Plains to Ohio Valley were drier than normal for August. Troughing gave western to central Alaska a cooler- and wetter-than-normal month, with warmer- and drier-than-normal conditions dominating the east and panhandle. Ridging contributed to warmer-than-normal temperatures over Puerto Rico and the U.S. Virgin Islands and a drier-than-normal month over the western Hawaiian Islands. Hurricane Hone gave the eastern Hawaiian Islands a wetter-than-normal month, while rain bands associated with Hurricane Ernesto brought above-normal August precipitation to most of Puerto Rico and the U.S. Virgin Islands.
Abnormally hot and dry weather over Canada contributed to numerous large wildfires over that country, while several large wildfires burned across the western CONUS with a few spreading into the northern Plains and developing in the Deep South. The total number of fires burned across the U.S. so far this year is below the 10-year average, but the total acreage burned is above average. Groundwater was low over large parts of the West, southern to central Plains, and Midwest to central Appalachians. Soils were dry in parts of the West, Plains, and central Appalachians, and drying rapidly from the Ohio Valley to central Gulf of Mexico coast (GRACE surface and root zone soil moisture; SPoRT soil moisture for 0-10 cm, 0-40 cm, 0-100 cm, 0-200 cm depths; CropCASMA topsoil and subsoil moisture; CPC soil moisture model). Monthly streamflow was quite low from the central Appalachians to central Gulf coast and across parts of the central to southern Plains and West; near-record low streamflows occurred in parts of the Appalachians to central Gulf coast during the last week of the month. Drought impacts reported by people experiencing drought increased as the month went on, with a massive increase near the end of the month in the central Appalachians and Deep South (National Drought Mitigation Center Condition Monitoring Observer Report maps for August 12-19, August 19-26, August 26-September 3).
The dry conditions resulted in expansion or intensification of drought and abnormal dryness across much of the Ohio Valley and central Appalachians to central Gulf of Mexico coast and large parts of the Great Plains, interior West, and Desert Southwest. But the above-normal precipitation along the East Coast and in Hawaii, and in parts of the West and southern to central Great Plains, contracted or reduced the intensity of drought and abnormal dryness compared to the end of July. Drought expansion far exceeded contraction with the USDM-based national moderate-to-exceptional drought footprint across the CONUS increasing from 19.9% at the end of July to 30.0% at the end of August (from 16.9% to 25.2% for the 50 states and Puerto Rico).
According to the Palmer Drought Index, which goes back to the beginning of the 20th century, about 22.2% of the CONUS was in moderate to extreme drought at the end of August, which is more than the value at the end of July.

Drought conditions at the end of August, as depicted on the September 3, 2024 USDM map, included the following core drought and abnormally dry areas:

- In the West, moderate (D1) to exceptional (D4) drought covers about 51.9% of the Pacific Northwest, which is more than last month, and moderate to extreme (D3) drought affected about 25.5% of the Southwest (Four Corners states), which is also more than last month. For the West as a whole, the percent area experiencing moderate to exceptional drought, according to USDM statistics, increased from 28.7% at the end of July to 35.8% at the end of August. Based on the Palmer Drought Index, the drought area across the West as a whole rose from 24.3% at the end of July (revised figure) to 29.7% at the end of August. Some reservoir levels were below average in the Pacific Northwest and Four Corners states, with mostly above-average reservoir levels in between these two regions. Westwide, August 2024 ranked as the 53rd wettest and 14th warmest August in the 1895-2024 record, April-August ranked 24th driest, June-August was second warmest, and the last 12 months ranked as the 63rd driest and sixth warmest September-August.
- New Mexico set a new drought duration record at the end of August. According to USDM statistics, New Mexico has experienced moderate or worse drought for 359 weeks, beginning on October 24, 2017.
- In the Great Plains, moderate to extreme drought covered about 32.6% of the central to northern Plains, which is more than last month, and moderate to exceptional drought covered 41.0% of the southern Plains, which is also more than (almost double) last month. The Lower Mississippi River Valley experienced a huge increase in the drought area, going from 2.7% at the end of July to 43.7% at the end of August. Drought doubled its area in Tennessee this month, expanding from 28.0% of the state at the end of July to 59.7% at the end of August. Taken together, the southern Plains, Lower Mississippi Valley, and Tennessee (South region) saw moderate to exceptional drought more than double from 16.1% at the end of July to 38.7% at the end of August.
- Oklahoma set a new drought duration record at the end of August. According to USDM statistics, Oklahoma has experienced moderate or worse drought for 267 weeks, beginning on July 30, 2019.
- Texas set a new drought duration record at the end of August. According to USDM statistics, at least part of Texas has experienced moderate or worse drought for 276 weeks, beginning on May 28, 2019.
- In the Midwest, drought was located in southern parts of the region, with exceptional drought developing in southeastern Ohio. The Midwest drought area increased from 4.5% at the end of July to 11.7% at the end of August.
- Exceptional drought developed in Ohio for the first time in the 25-year USDM record, affecting 7.4% of the state on September 3, 2024.
- Drought expanded in the Southeast this month, going from 20.8% at the end of July to 29.0% at the end of August. Moderate to severe drought persisted in parts of Virginia and spread across Alabama and the Florida panhandle.
- The remnants of Hurricane Debby dumped rain on northern and eastern parts of the Northeast region, contracting drought and abnormal dryness. But western parts (especially West Virginia) missed out on the rain, with drought intensifying. For the region as a whole, the drought area contracted, going from 20.8% by the end of July to 15.8% by the end of August.
- Exceptional drought developed in West Virginia for the first time in the 25-year USDM record, affecting 5.8% of the state on September 3, 2024. At the end of August, 98.8% of the state was in drought, exceeded only once when 100% was in drought in September 2002. But when the area and the severity are considered together, a new Drought Severity and Coverage Index (DSCI) record was set at the end of August with a score of 341.7.
- Moderate to severe drought shrank in Hawaii, going from 54.7% of the state at the end of July to 21.1% at the end of August.
- A small area of moderate drought persisted in the Alaska panhandle, covering about 1.1% of the state at the end of August.
- In the U.S.-Affiliated Pacific Islands (USAPI), 1 station was in moderate drought and 5 stations were abnormally dry at the end of August. This compares to only 1 station abnormally dry at the end of July.
Palmer Drought Index
The Palmer drought indices measure the balance between moisture demand (evapotranspiration driven by temperature) and moisture supply (precipitation). The Palmer Z Index depicts moisture conditions for the current month, while the Palmer Hydrological Drought Index (PHDI) and Palmer Drought Severity Index (PDSI) depict the current month's cumulative moisture conditions integrated over the last several months.

While both the PDSI and PHDI indices show long-term moisture conditions, the PDSI depicts meteorological drought while the PHDI depicts hydrological drought. The PDSI map may show less severe and extensive drought (as well as wet spell conditions) in some parts of the country than the PHDI map because the meteorological conditions that produce drought and wet spell conditions are not as long-lasting as the hydrological impacts.

Used together, the Palmer Z Index and PHDI maps show that short-term drought occurred in interior parts of the West, from the Southwest to southern Plains, and from the central Gulf of Mexico coast to the Ohio Valley and central Appalachians, expanding, intensifying, or introducing long-term drought areas and shrinking long-term wet areas (PHDI maps for August compared to July). Short-term wet conditions occurred in the northern Plains to Upper Midwest, Northeast, central Rockies, and coastal Southeast, expanding or intensifying long-term wet conditions or shrinking long-term drought.
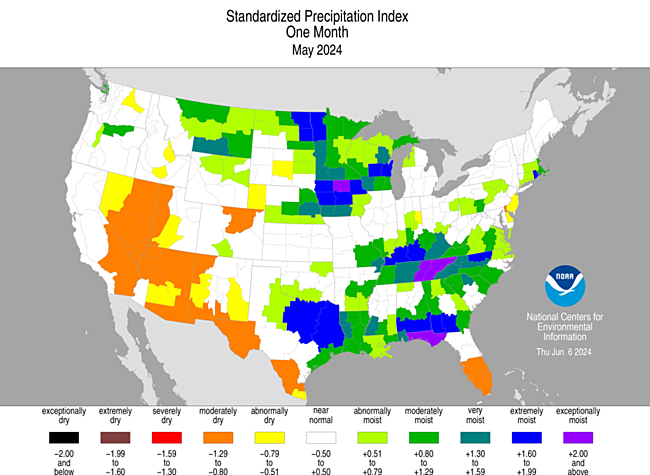
Standardized Precipitation Index
The Standardized Precipitation Index (SPI) measures moisture supply. The SPI maps here show the spatial extent of anomalously wet and dry areas at time scales ranging from 1 month to 24 months.


The SPI maps illustrate how moisture conditions have varied considerably through time and space over the last two years. The central Gulf of Mexico coast states to Tennessee Valley are extremely dry at the 1-month time scale with dryness extending to the 3-month time scale. There is some dryness at 6 months, but more widespread dryness at 12-24 months. The central Appalachians are dry at all time scales. The Ohio Valley has dryness at 1, 3, and 12-24 months. Parts of the southern Plains are dry at 1-6 months, with dryness in the Rio Grande Valley at all time scales. Parts of the central Plains are dry at 1-6 and 24 months. Parts of the northern Plains are dry at 2-9 months. The Pacific Northwest has dryness at all time scales except 1 month, with the dryness most widespread at 3-6 months. The Desert Southwest is dry at 1-6 months. Wet conditions dominate the Northeast and parts to most of the Upper Midwest and Southeast coast at all time scales, eastern Texas to parts of Louisiana at 2-24 months, coastal parts of the Pacific Northwest at 1-2 and 9 months, the central Rockies at 1-9 months, and California to the Great Basin at 24 months.


Standardized Precipitation Evapotranspiration Index
The SPI measures water supply (precipitation), while the SPEI (Standardized Precipitation Evapotranspiration Index) measures the combination of water supply (precipitation) and water demand (evapotranspiration as computed from temperature). Warmer temperatures tend to increase evapotranspiration, which generally makes droughts more intense.


For the Northern Hemisphere, August marks the end of climatological summer, which is the season when sun angle, temperatures, and evapotranspiration are maximum. During August 2024, temperatures were warmer than normal across the Southwest to central Gulf of Mexico coast, with record warmth locally in the Southwest and southern Plains. August temperatures were near to cooler than normal (1991-2020 normal) in the Northwest, but above the long-term average, because of a long-term warming trend. Evapotranspiration rates were unusually high in the South because of the heat, and where it was both hot and dry, the 1-month SPEI values were more extreme (dry) than the corresponding SPI, especially across the Southwest to southern Plains. Temperatures were unusually warm across much of the CONUS for the last 2 to 3 months, and even out to 6 months, especially in the West, South, and Northeast. Dryness in the West, central Appalachia, and western Texas extended back over this time frame. The heat made drought conditions worse, so the SPEI values were more extreme than the SPI values for the last 2 to 6 months, especially in the West. Conditions were not as dry at the 8- to 12-month time scales, but the SPEI was still more extreme than the SPI in many of these places (SPEI maps for the last 1, 2, 3, 6, 7, 12 months) (SPI maps for the last 1, 2, 3, 6, 7, 12 months).


The combination of heat and dryness in the West resulted in record to near-record low SPEI values:
- Nevada had a record dry 3-month August SPEI (tied with summer 2020) while the SPI didn't even rank in the top 20 driest category. The second hottest summer on record contributed to the record dry SPEI, while the statewide precipitation rank was only 24th driest.
- California had the second driest 3-month August SPEI while the SPI didn't even rank in the top 20 driest category. The hottest summer on record contributed to the near-record dry SPEI, while the statewide precipitation rank was only 23rd driest.
- The Trans Pecos region of Texas (climate division 5) had the second driest 6-month August SPEI; the SPI wasn't as dry in comparison, but it did rank in the top 5 category.
- Interestingly, Alabama had the second driest August SPEI but the driest August SPI. This is because August 2024 ranked driest on record, statewide, while the statewide temperature rank was only 19th warmest.


The last 1 to 6 years have been unusually warm across most of the CONUS, with record heat in the Northeast and South (state temperature rank maps for the last 1, 2, 3, 4, 5 years). Precipitation in the last 12 months has helped reduce deficits in many areas. But August 2024 was very dry from the Ohio Valley to Gulf of Mexico coast and from the Desert Southwest to southern Plains. When combined with July 2024 dryness, the last 2 months were quite dry in the central Appalachians, Tennessee to Lower Mississippi valleys, southern Plains (especially western and northern Texas), and parts of the West. For the last 12 months, dryness has dominated from the central Appalachians to central Gulf coast and in the northern Rockies. The last 2 years have been extremely dry in the Pacific Northwest and Ohio Valley to central Gulf coast as well as the central Appalachians, the last 3 years were dry in the central and southern Plains and central Appalachians, and the last 4 to 5 years have been quite dry in the West to Great Plains (state precipitation rank maps for the last 1, 2, 3, 4, 5 years). In the last 1 to 6 years, the SPEI is more extreme than the SPI in the Pacific Northwest and central Appalachians to Tennessee Valleys, but especially in the Southwest to Lower Mississippi Valley. In the western U.S., where drought has dominated for much of the last 20 years, the combination of excessive heat and dryness has resulted in more extreme SPEI values than SPI values in parts of the West for the last 2 to 6 years, especially at the longer time scales (SPEI maps for last 12, 18, 24, 30, 36, 48, 60, 72 months) (SPI maps for last 12, 18, 24, 30, 36, 48, 60, 72 months).


A focus of the heat and dryness over the last 6 years has been the Lower Rio Grande Valley, as illustrated by the Texas Trans Pecos (Texas climate division 5). The Trans Pecos division has had record low SPEI values for the last 30-48 months while the SPI has been dry but not record dry. At the 60-month time scale, the SPEI (the combination of persistent heat and dryness) is comparable to the lengthy record droughts of the early 2000s and 1950s, whereas the SPI (just the persistently low precipitation) is nowhere near as extreme or persistent as the dryness in the early 2000s and 1950s:
- The Trans Pecos had a record dry 30-month August SPEI while the SPI was second driest.
- The Trans Pecos had a record dry 36-month August SPEI while the SPI was in the top 10 driest category.
- The Trans Pecos had a record dry 48-month August SPEI while the SPI was in the top 10 driest category.
- Even at the 60-month time scale, the Trans Pecos SPEI tied with 1956 as the third driest while the SPI ranked 12th driest.
- At the 24-month time scale, the Trans Pecos SPEI was second driest (behind 2011) while the SPI ranked sixth driest.
Regional Discussion
Rio Grande River Basin


During October 2023-August 2024, parts of the Rio Grande River Basin were wetter than normal, parts drier than normal, and parts near normal. But very dry and hot conditions of summer and early fall last year created significant precipitation deficits and expanded drought. In 2024, June was near to wetter than normal and July was near to drier than normal, but April, May, and August were mostly drier than normal. The basin had the 22nd driest August in the 1895-2024 record and 36th driest March-August (last 6 months). Temperatures have also been anomalously warm — in fact, record warm over the last 12 months. According to the USDM, 55.7% of the basin was in moderate to exceptional drought at the end of August, which is a little less than the 60.1% at the end of July. Based on the Palmer Drought Index, 77.9% of the basin was in moderate to extreme drought at the end of August, which is more than the end of July but less than the peak of 100% that occurred just last year and many times in the last 30 years, 1950s, and early 1900s.
Pacific Northwest River Basin


Parts of the Pacific Northwest River Basin were wetter than normal in August 2024, but other parts were drier than normal. Interior parts were very dry over the last 6 months. Rain along the coast gave the basin as a whole the 44th wettest August in the 130-year record, but April-August 2024 ranked 34th driest and the last 24 months ranked 23rd driest. According to the USDM, 52.0% of the basin was in moderate to exceptional drought at the end of August, which is more than the 46.3% at the end of July. Based on the Palmer Drought Index, 44.7% of the basin was in moderate to extreme drought at the end of August, which is more than the end of July but less than the peak of 100% that occurred in 2021 and many times in the last 40 years, 1970s, and 1930s.
West Virginia


As discussed earlier, West Virginia experienced exceptional drought for the first time in the 25-year USDM history and has the most severe USDM DSCI value in the state's record. This is due to extremely dry conditions that occurred in August and the last 3 to 6 months, but also dry conditions that have been ongoing in parts of the state for the last 2 years or longer (reference the SPI maps in an earlier section). Statewide, West Virginia had the 26th driest August, fifth driest June-August, 23rd driest September-August (last 12 months), and 13th driest March 2023-August 2024 (last 18 months). According to the USDM, 99.0% of the state was in moderate to exceptional drought at the end of August, which is a rapid increase from zero percent in early June. U.S. Department of Agriculture statistics indicate that 100% of the state's topsoil and subsoil moisture was dry or very dry, and their pasture and range condition index for the state had reached record low levels based on data for the last 22 years.
Hawaii


August 2024 was drier than normal across the western Hawaiian Islands, with the Big Island receiving locally heavy rains from Hurricane Hone. A dry/west and wet/east pattern persisted at the 2- and 3-month time scales. Oahu and parts of the Big Island and Maui were wetter than normal at the 4- to 5-month time scales with drier-than-normal conditions dominating on the other main islands. At 6 to 12 months, it was generally drier than normal on Kauai, Molokai, and Maui and mostly wetter than normal on Oahu and the Big Island. A mixed precipitation anomaly pattern was evident at longer time scales (precipitation anomaly maps for the last 1, 2, 3, 4, 5, 6, 8, 9, 11, 12, 24, 36, 48, 60 months) (climate engine model percent of normal precipitation map for the last month).
Monthly streamflow was above normal on the Big Island, below normal on Kauai, and near normal on the main islands in between. Based on satellite analyses (stressed vegetation, drought stress, VHI), vegetation was stressed on parts of all of the islands, in spite of Hone's rain, with the greatest stress on the Big Island, Molokai, and Maui.
With the first half of August dry, extreme drought developed and the drought area expanded to a peak of 73.1% on the August 20 USDM map. But after the rain from Hurricane Hone, extreme drought disappeared and the drought area in Hawaii shrank to about 21.1% of the state on the September 3, 2024 USDM map.
Alaska


August 2024 was drier than normal in the panhandle, Aleutian Island chain, and several Southeast Interior stations, but wetter than normal in most other areas. The southern Panhandle and some eastern interior stations were persistently dry at 1- to 9-month time scales, there were drier-than-normal stations in the Cook Inlet/Northwest Gulf region at 6 to 12 months, and the Aleutians were mostly drier than normal at 1 to 12 months. Wetter-than-normal conditions dominated at longer time scales, except at some stations from the Aleutians to Cook Inlet (low elevation station precipitation anomaly maps for the last 1, 2, 3, 4, 5, 6, 8, 9, 11, 12, 24, 36, 48, 60 months) (high elevation SNOTEL station precipitation percentile maps for the last 1 and 4 months) (SNOTEL basin and station percent of normal precipitation maps for the last 1 and 4 months) (climate division precipitation rank maps for the last 1, 3, 6, 8, and 12 months) (climate engine model percent of normal precipitation map for the last month) (ACCAP percent of average precipitation map) (Leaky Bucket model precipitation percentile map).
August temperatures averaged near to cooler than normal in western parts of the state and warmer than normal in the east. This pattern mostly held at the 2- to 12-month time scales, based on station data and recent (1991-2020) normals. Warmer-than-average temperatures spread westward at the longer time scales and essentially covered the state by 12 months, based on climate division data and compared to the long-term (1925-2024) average. This difference is due to a pronounced warming trend in recent decades (low elevation station temperature anomaly maps for the last 1, 2, 3, 4, 8, 11, 12 months) (climate division temperature rank maps for the last 1, 3, 6, 8, and 12 months) (gridded temperature percentile maps for the last 1, 3, and 8 months) (Leaky Bucket model temperature percentile map).
Monthly streamflow was below normal in the panhandle and for some streams in the Northwest Gulf, but most streams were near to above normal. Satellite observations of vegetative health (stressed vegetation, drought stress, VHI) revealed some areas of stressed vegetation. Satellite-based or modeled observations of groundwater and soil moisture (GRACE root zone and GRACE surface soil moisture; Leaky Bucket modeled soil moisture) suggested some dryness was occurring in the southern panhandle and other parts of the south and east.
Areas of abnormal dryness continued in the east with moderate drought continuing in the southern Panhandle, covering about 1.1% of the state on the September 3, 2024 USDM map.
Puerto Rico and U.S. Virgin Islands


August 2024 was mostly wetter than normal across the U.S. Virgin Islands (USVI) and Puerto Rico (PR), thanks to rain bands associated with Hurricane Ernesto. Wetter-than-normal conditions dominated the 2- to 8-month time periods. Some drier-than-normal areas in PR were evident at 9 to 12 months. A mixed precipitation anomaly pattern dominated at longer time periods (low elevation station precipitation anomaly maps for the last 1, 2, 3, 4, 5, 6, 8, 9, 11, 12, 24, 36, 48, 60 months) (radar-based percent of normal precipitation maps for the last 1, 2, 3, 4 months) (climate engine model percent of normal precipitation map for the last month: PR and USVI, Caribbean and Gulf of Mexico region).
Temperatures were generally warmer than normal for the last 1 to 12 months (low elevation station temperature anomaly maps for the last 1, 2, 3, 4, 8, 11, 12 months).
Root zone analysis indicated that soil conditions were mostly wet except for some small areas along the northwestern and southern coasts of PR (root zone soil saturation fraction). Satellite observations of vegetative health (stressed vegetation for PR and USVI, drought stress for PR and USVI, VHI for PR and USVI) revealed few if any areas of stressed vegetation. Monthly streamflow on PR showed near- to above-normal stream levels. In the USVI, groundwater levels rose rapidly when the rains from Ernesto occurred early in the month, then they fell sharply at St. Thomas but held steady at St. John and St. Croix. The end-of-August groundwater level was in the middle third of the recent historical record at St. Croix, but continued in the upper third at St. John and St. Thomas.
PR and the USVI continued free of drought and abnormal dryness on the September 3, 2024 USDM map.
CONUS State Precipitation Ranks


August 2024 was drier than normal across much of the central Appalachians and Ohio Valley to central Gulf of Mexico coast as well as the Desert Southwest to southern Plains, with record dryness occurring locally in these areas. Fifteen states had a precipitation rank in the driest third of the historical record for August. Four ranked in the top ten driest category — Alabama and Mississippi (both driest August on record), Tennessee (second driest), and Texas (ninth driest) — and one came close: Louisiana (12th driest). Record dryness occurred in parts of Ohio and West Virginia, but near normal or wet conditions happened in other parts of those states, which knocked them out of the top ten or even top 20 driest category.


June-August 2024 was drier than normal across the central Appalachians and Ohio Valley to central Gulf of Mexico coast, much of the West, and large parts of the Plains, with record dryness occurring locally in the central Appalachians and Tennessee Valley. Fifteen states had a precipitation rank in the driest third of the historical record for summer. Three ranked in the top ten driest category — West Virginia (fifth driest), Ohio (seventh driest), and Tennessee (ninth driest) — and two came close: Mississippi (14th driest) and Wyoming (16th driest).


March-August 2024 was drier than normal across much of the West and parts of the Plains, central Appalachians, and Ohio Valley to central Gulf states. Seven states had a precipitation rank in the driest third of the historical record for March-August. None ranked in the top ten driest category — mainly due to wet or near normal conditions occurring in parts of the states where other parts were dry — but one came close: West Virginia (17th driest).
The year to date (January-August 2024) was drier than normal in parts of the Northwest, Great Plains, and central Appalachians. Only two states had a precipitation rank in the driest third of the historical record for January-August, and none ranked in the top ten driest category for the same reason that none did for March-August. In fact, large parts of the CONUS were very wet for this period.


The last 12 months (September 2023-August 2024) were drier than normal across much of the central Appalachians and Ohio Valley to central Gulf of Mexico coast, the Rio Grande Valley, and parts of the West and central to northern Plains. Eight states had a precipitation rank in the driest third of the historical record for September-August. None ranked in the top ten driest category, but one came close: Tennessee (18th driest).
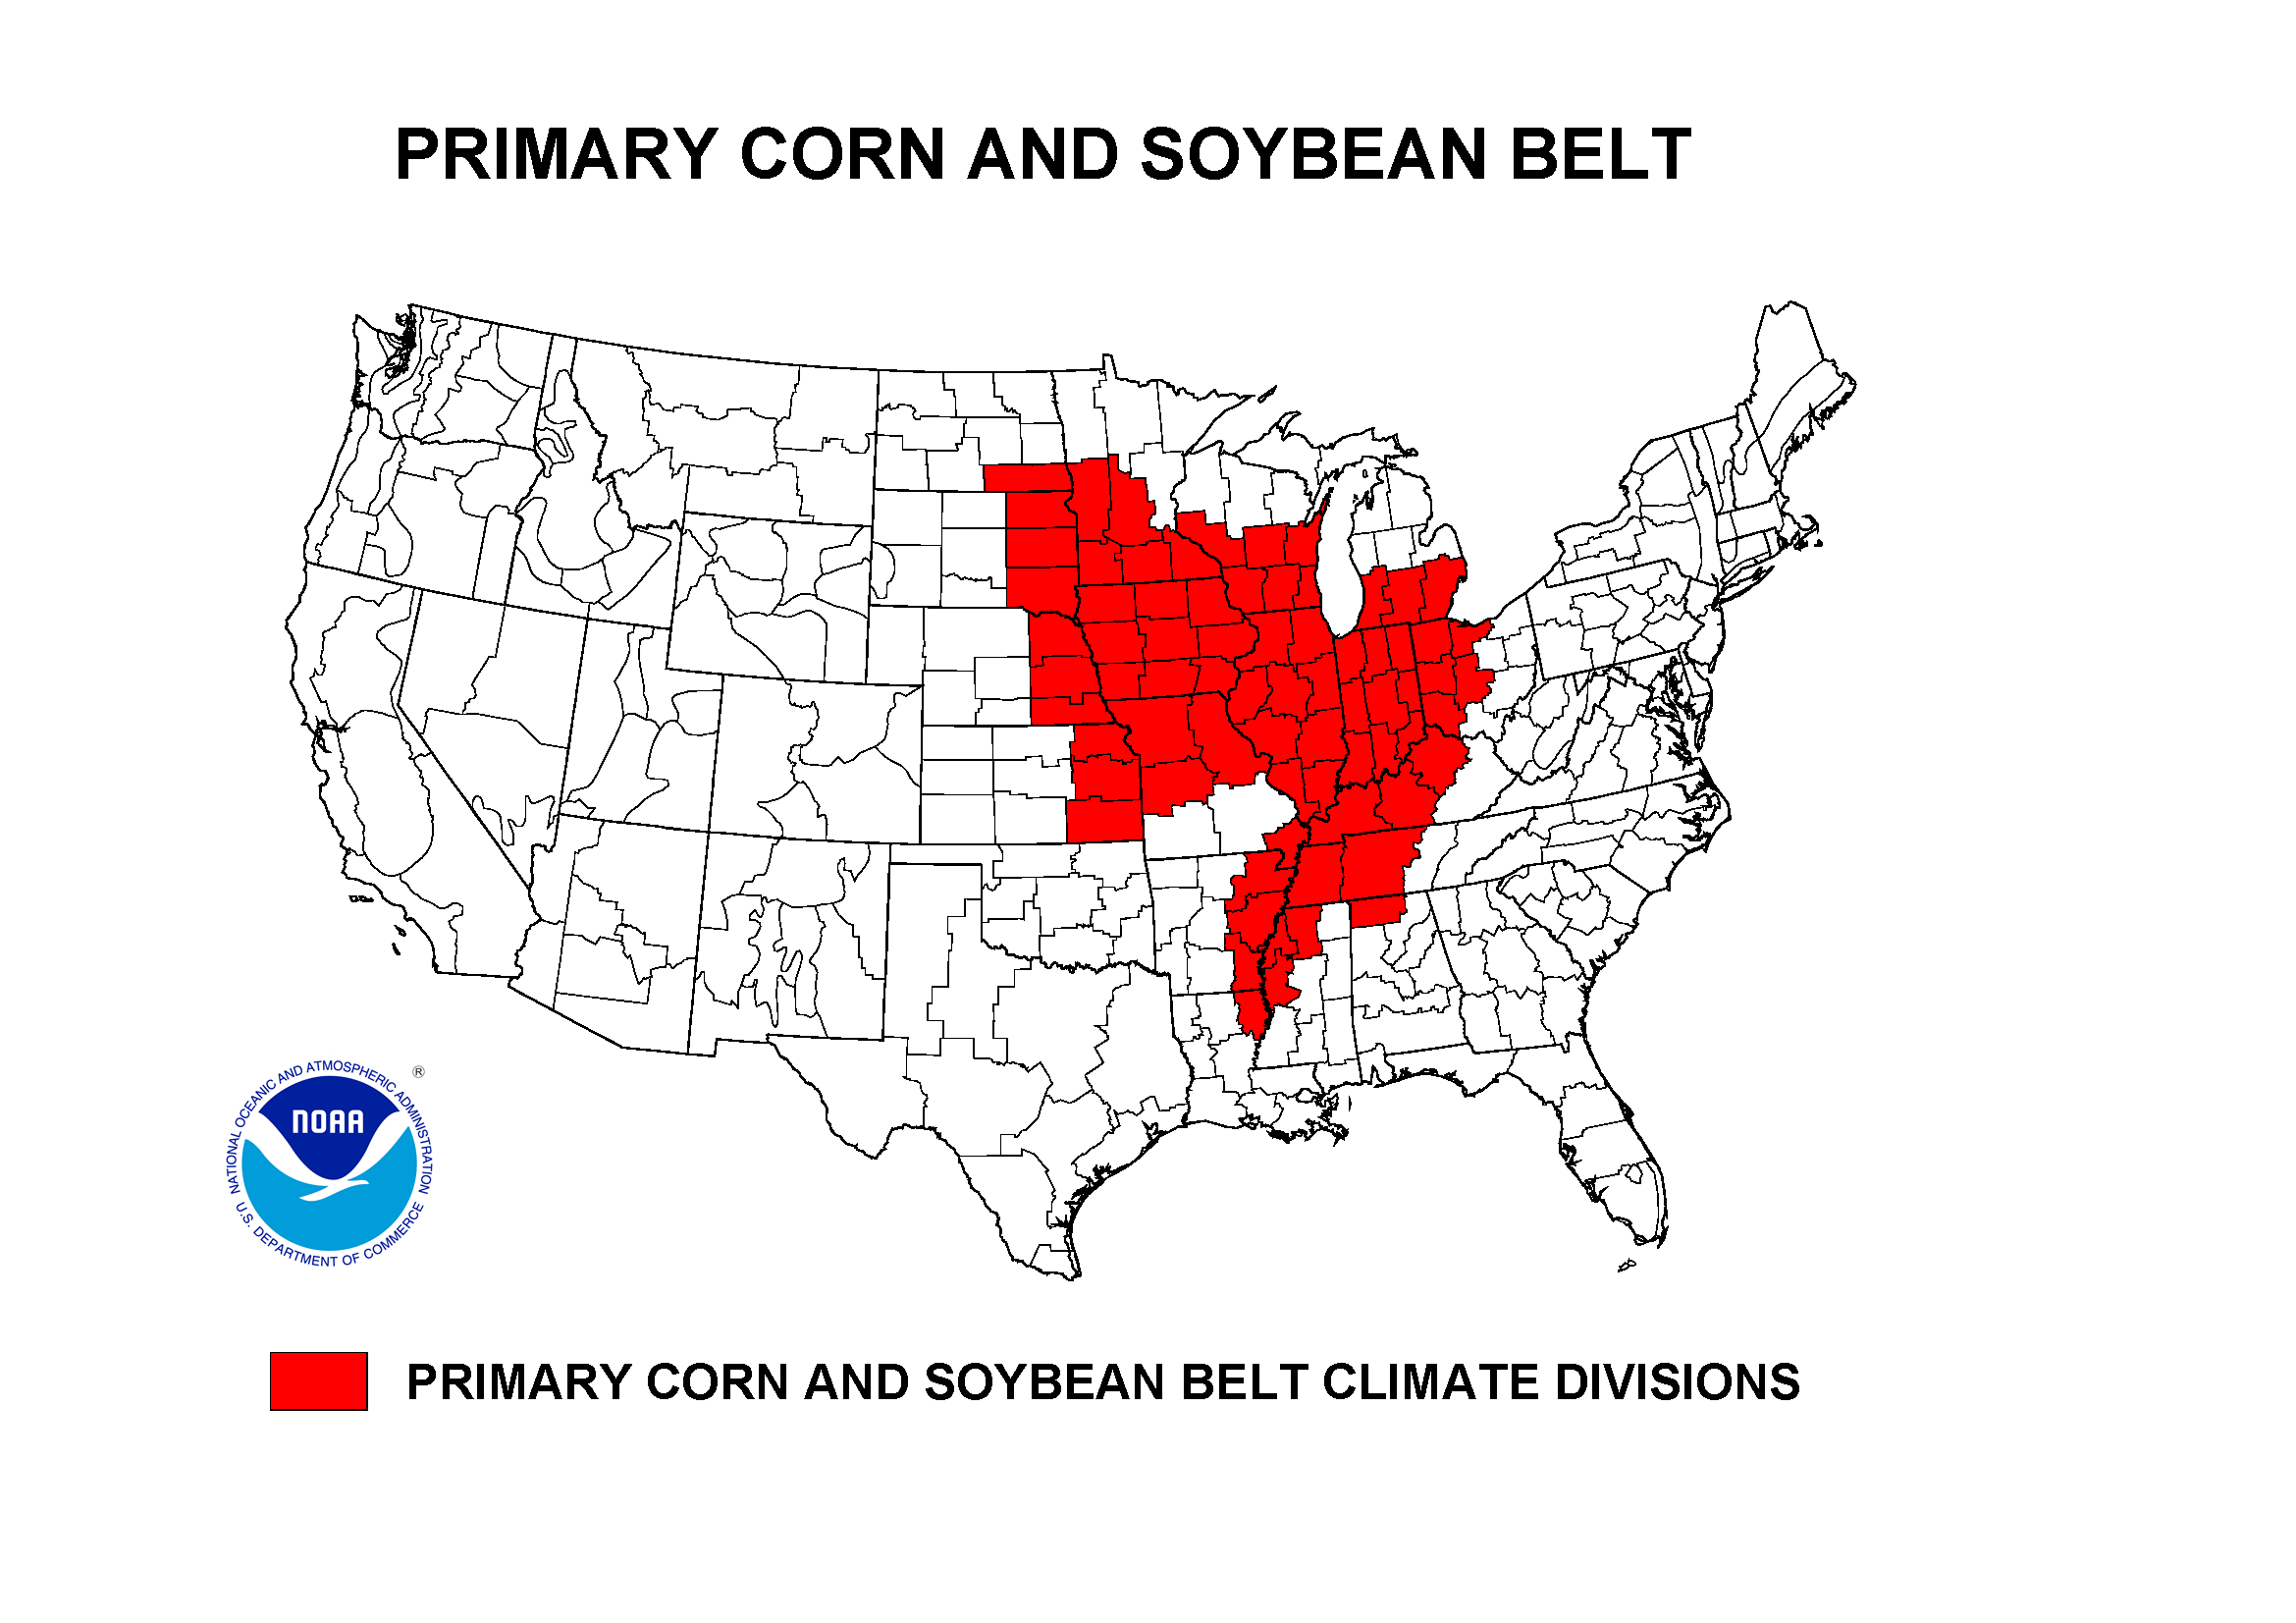
Agricultural Belts


During August 2024, the Primary Corn and Soybean agricultural belt was mostly drier than normal in the south with a mixed precipitation anomaly pattern to the north; temperatures ranged from slightly cooler to slightly warmer than normal. The month ranked as the 29th driest and 54th warmest August, regionwide, in the 1895-2024 record.
March marks the beginning of the growing season for the Primary Corn and Soybean belt. March-August 2024 was warmer than normal and mostly wetter than normal in the northwest to drier than normal in the southeast. The period ranked as the ninth warmest and 16th wettest March-August, regionwide, in the historical record.
According to the U.S. Department of Agriculture (USDA), as of September 3, 2024, drought affected approximately 36% of barley production, 13% of corn production, 42% of cotton production, 39% of sorghum production, 19% of soybean production, 22% of spring wheat production, 52% of winter wheat production, 31% of hay acreage, 24% of the cattle inventory, 12% of the milk cow inventory, and 28% of the sheep inventory. These percentages are all higher than last month.


Based on September 1 USDA statistics, 12% of the corn crop, 10% of the soybean crop, and 42% of the pasture and rangeland were in poor to very poor condition, and 46% of the nation's topsoil and 43% of the subsoil were short or very short of moisture (dry or very dry). States with the driest soils were in the Mid-Atlantic to Ohio and Tennessee Valleys, Pacific Northwest, and central and southern Plains to Rocky Mountains, and bordering the Gulf of Mexico.
U.S.-Affiliated Pacific Islands
The NOAA National Weather Service (NWS) offices, the Pacific ENSO Applications Climate Center (PEAC), and partners provided reports on conditions across the Pacific Islands.
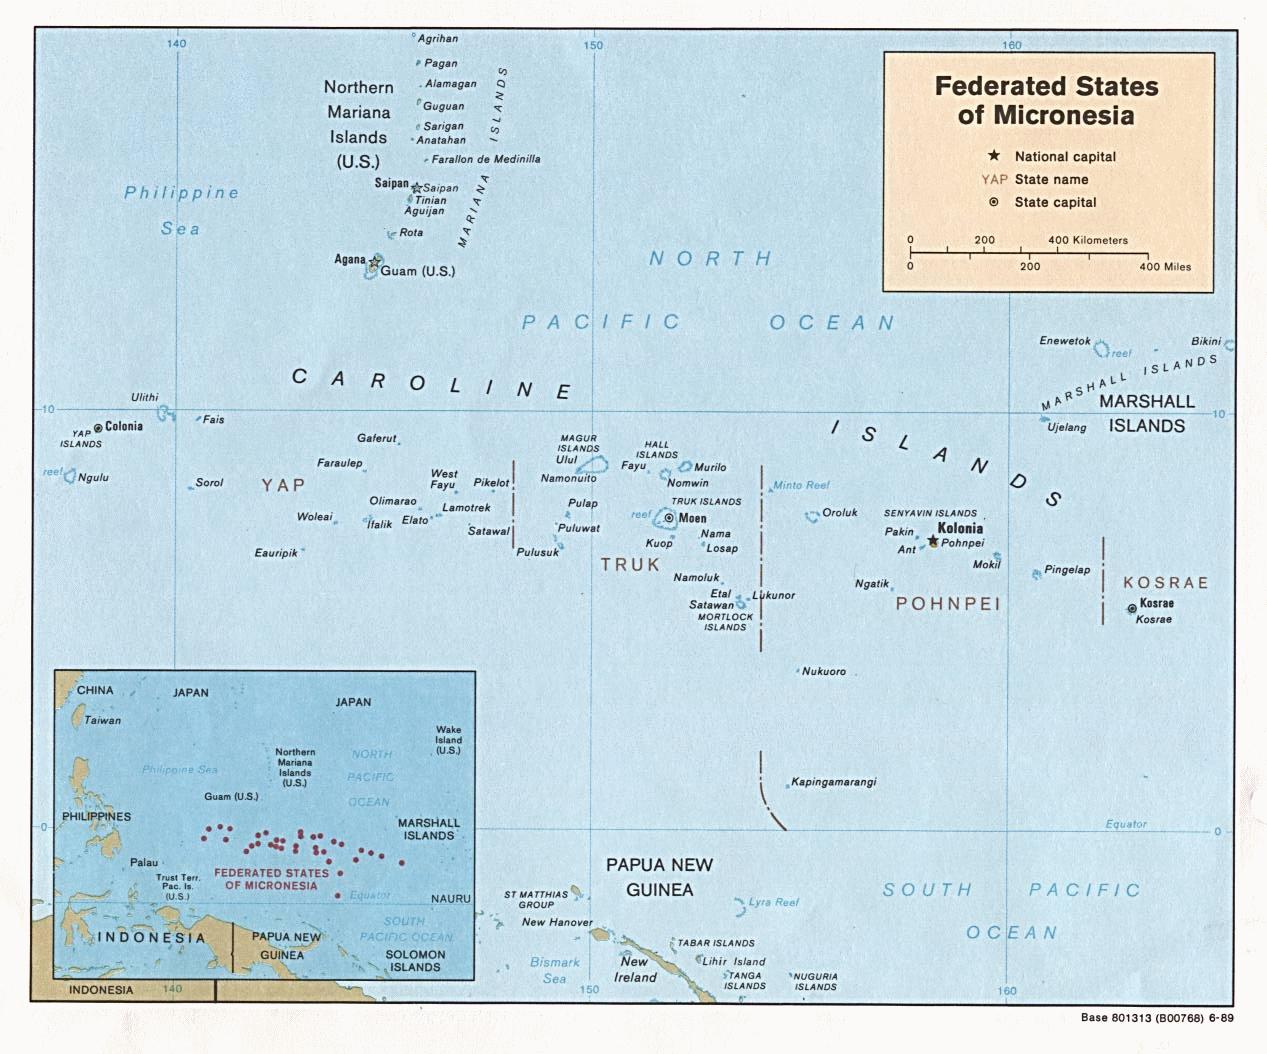
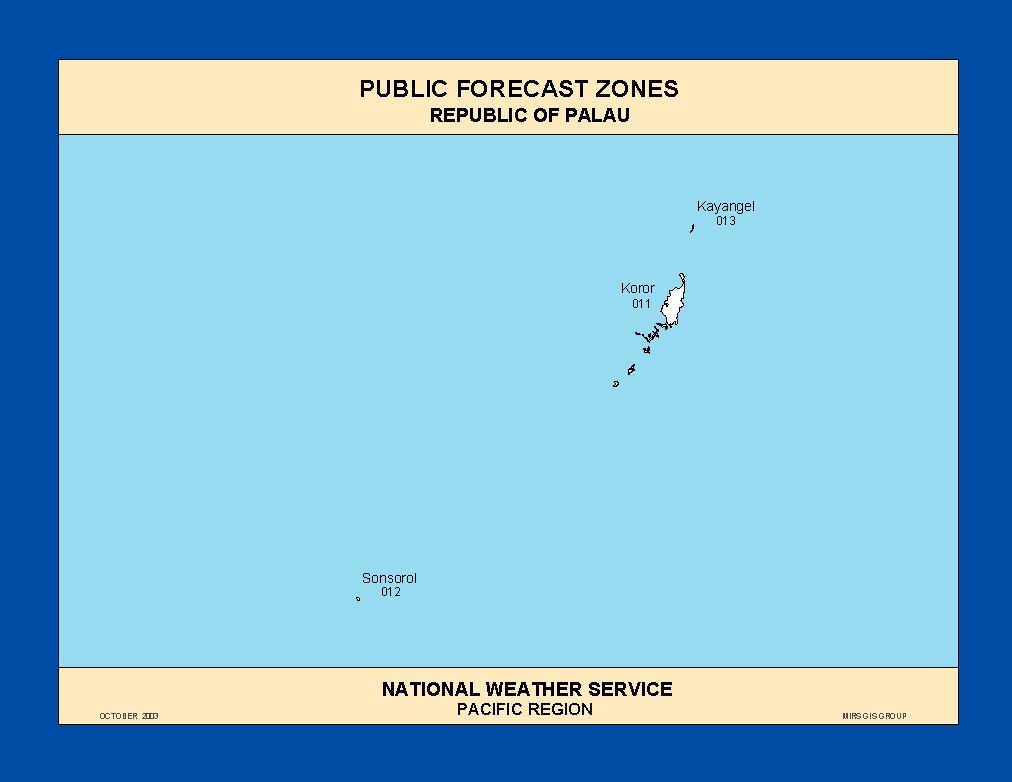
In the U.S. Affiliated Pacific Islands (USAPI) (maps — Federated States of Micronesia [FSM], Northern Mariana Islands, Marshall Islands [RMI], Republic of Palau [ROP], American Samoa, basinwide), August 2024 was wetter than normal at Guam and Pago Pago, but drier than normal at the rest of the main USAPI stations.
Monthly precipitation amounts were below the monthly minimum needed to meet most water needs (4 inches in the Marianas and Pago Pago, and 8 inches elsewhere) at Ulithi, Pohnpei, Lukunor, Nukuoro, and Kapingamarangi in the FSM, and at Wotje, Majuro, and Jaluit in the Marshall Islands. August precipitation was above the monthly minimums in American Samoa, Palau, the Marianas, and the rest of the FSM and Marshalls. The 4- and 8-inch thresholds are important because, if monthly precipitation falls below the threshold, then water shortages or drought become a concern.
The tropical Pacific climatology can experience extremes in precipitation, from very low precipitation during the dry season to very high precipitation during the wet season. This can result in monthly normal precipitation values that are different from the monthly minimum needed to meet most water needs, and this can lead to percent of normal values that seem odd. This was the case during August 2024, which is in the wet season for most of Micronesia, and in the dry season for American Samoa and Kapingamarangi. Precipitation was above the monthly minimum but below normal (1981-2010 normal), because the normals are high, at:
- Airai: August 2024 precipitation 8.40 inches, August normal mean 13.92 inches, August normal median 13.50 inches.
- Rota: August 2024 precipitation 9.49 inches, August normal mean 14.15 inches.
- Kosrae: August 2024 precipitation 10.24 inches, August normal mean 14.81 inches, August normal median 14.22 inches.
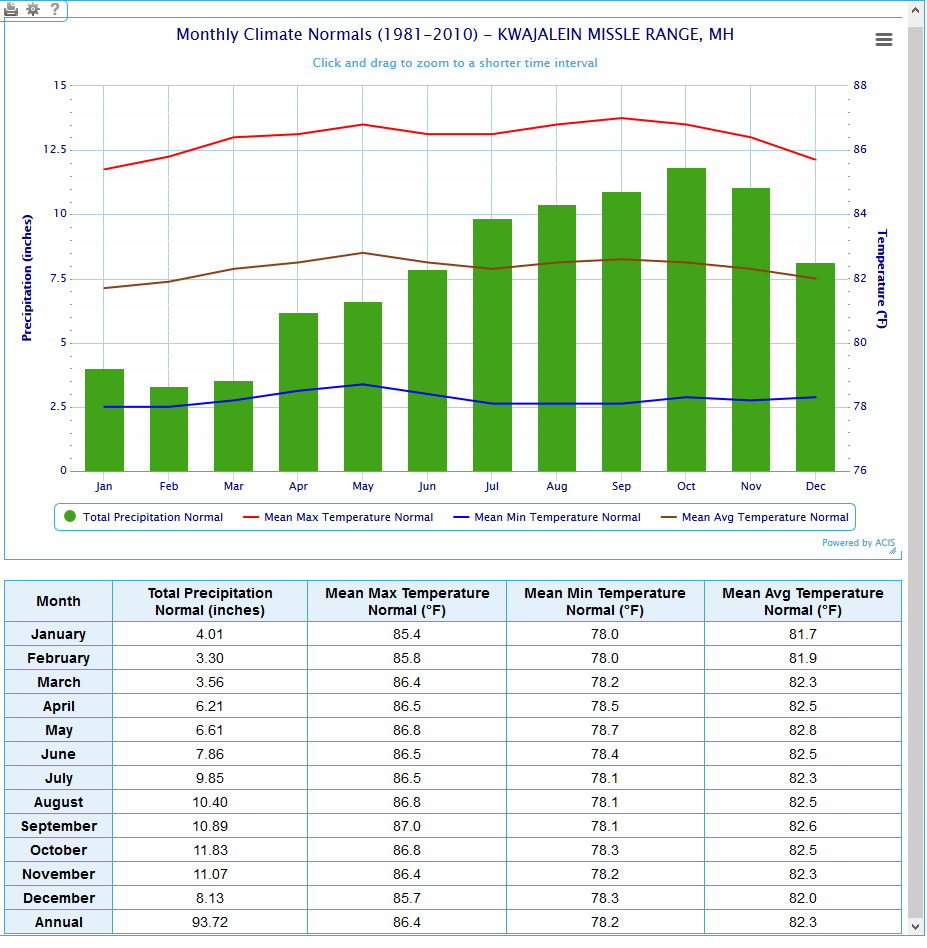
- Kwajalein: August 2024 precipitation 8.43 inches, August normal mean 10.40 inches, August normal median 9.74 inches.
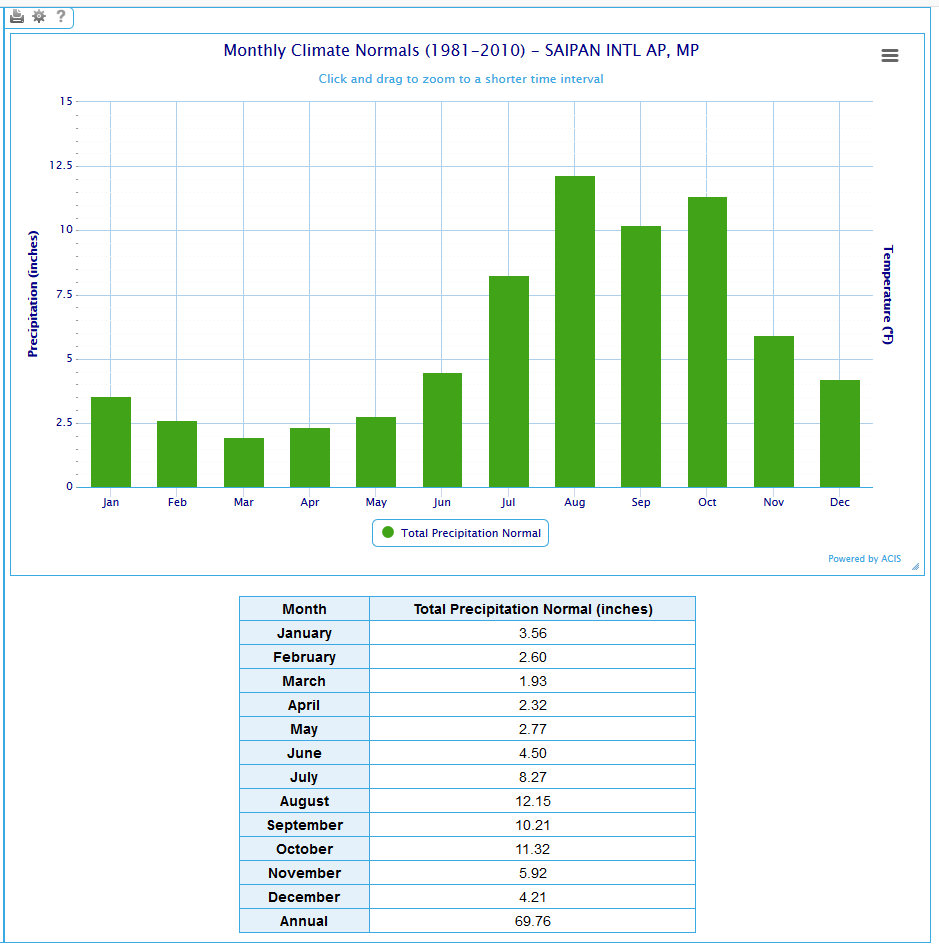
- Saipan: August 2024 precipitation 9.40 inches, August normal mean 12.15 inches, August normal median 13.13 inches.
- Yap: August 2024 precipitation 12.28 inches, August normal mean 15.46 inches, August normal median 14.82 inches.
- Woleai: August 2024 precipitation 10.23 inches, August normal mean 14.94 inches.
- Ailinglaplap: August 2024 precipitation 9.54 inches, August normal mean 10.65 inches.
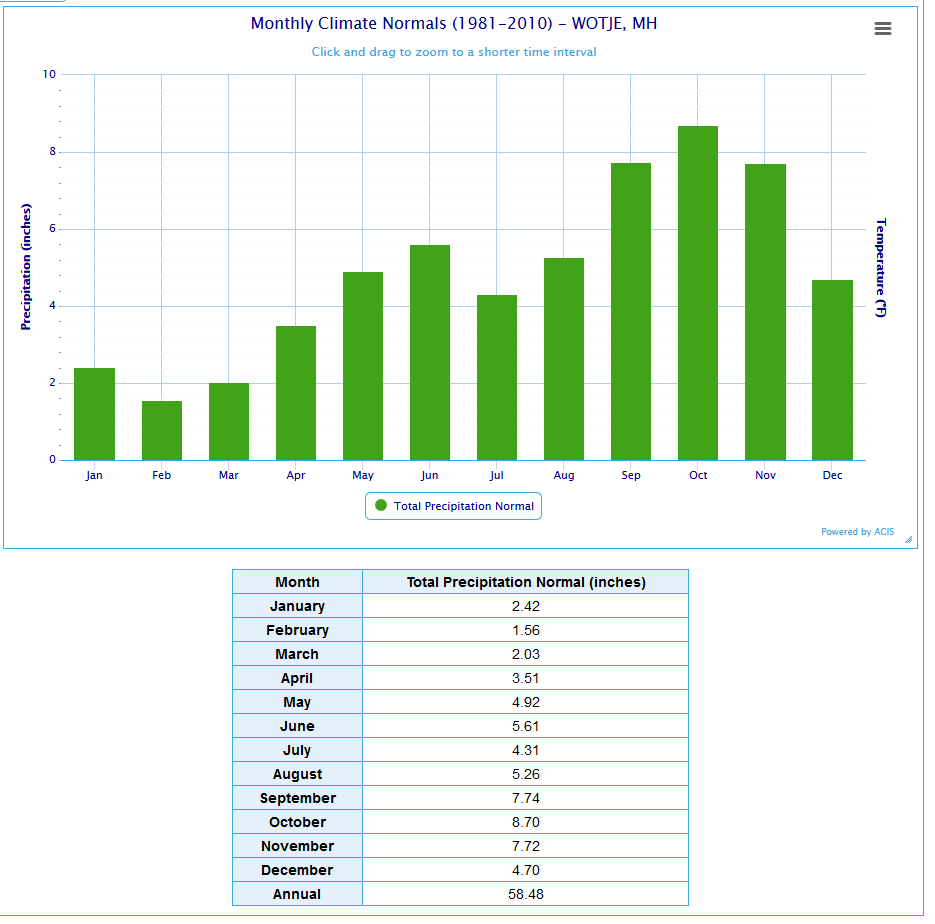
- Wotje: August 2024 precipitation 6.90 inches, August normal mean 5.26 inches.
In the table below, the station identified as Koror is Palau International Airport (Airai).
| Station Name | Sep 2023 | Oct 2023 | Nov 2023 | Dec 2023 | Jan 2024 | Feb 2024 | Mar 2024 | Apr 2024 | May 2024 | Jun 2024 | Jul 2024 | Aug 2024 | Sep- Aug |
|---|---|---|---|---|---|---|---|---|---|---|---|---|---|
| Chuuk | 112% | 110% | 141% | 100% | 100% | 76% | 40% | 99% | 95% | 132% | 128% | 80% | 99% |
| Guam NAS | 98% | 152% | 84% | 107% | 59% | 62% | 78% | 283% | 112% | 129% | 74% | 101% | 90% |
| Kapingamarangi | 256% | 117% | 153% | 74% | 188% | 206% | 196% | 99% | 95% | 48% | 65% | 28% | 108% |
| Koror | 130% | 108% | 85% | 67% | 136% | 140% | 48% | 184% | 59% | 98% | 106% | 62% | 92% |
| Kosrae | 123% | 153% | 163% | 44% | 90% | 119% | 96% | 84% | 124% | 109% | 154% | 72% | 91% |
| Kwajalein | 61% | 103% | 156% | 111% | 53% | 52% | 196% | 80% | 166% | 147% | 111% | 87% | 106% |
| Lukonor | 115% | 136% | 81% | 94% | 64% | 76% | 153% | 164% | 150% | 113% | 58% | 52% | 91% |
| Majuro | 56% | 86% | 101% | 70% | 57% | 74% | 16% | 111% | 150% | 99% | 79% | 61% | 81% |
| Pago Pago | 156% | 91% | 36% | 195% | 142% | 201% | 71% | 115% | 211% | 186% | 81% | 124% | 120% |
| Pohnpei | 156% | 83% | 178% | 48% | 50% | 170% | 91% | 116% | 121% | 104% | 137% | 49% | 104% |
| Saipan | 109% | 92% | 133% | 158% | 74% | 79% | 83% | 67% | 53% | 213% | 42% | 72% | 91% |
| Yap | 70% | 88% | 79% | 41% | 90% | 55% | 14% | 33% | 77% | 55% | 134% | 83% | 72% |
| Station Name | Sep 2023 | Oct 2023 | Nov 2023 | Dec 2023 | Jan 2024 | Feb 2024 | Mar 2024 | Apr 2024 | May 2024 | Jun 2024 | Jul 2024 | Aug 2024 | Sep- Aug |
|---|---|---|---|---|---|---|---|---|---|---|---|---|---|
| Chuuk | 13.07" | 12.70" | 14.93" | 11.22" | 10.05" | 5.49" | 3.30" | 12.38" | 10.76" | 15.38" | 15.37" | 10.32" | 134.97" |
| Guam NAS | 12.46" | 17.40" | 6.18" | 5.49" | 2.38" | 1.88" | 1.62" | 7.17" | 3.82" | 8.00" | 7.51" | 14.84" | 88.75" |
| Kapingamarangi | 25.45" | 9.55" | 14.14" | 7.33" | 17.18" | 19.05" | 22.43" | 13.53" | 11.42" | 6.59" | 9.21" | 2.29" | 158.17" |
| Koror | 15.26" | 12.80" | 9.65" | 7.46" | 13.85" | 11.97" | 3.56" | 13.44" | 7.01" | 17.05" | 19.72" | 8.40" | 140.17" |
| Kosrae | 17.52" | 16.79" | 22.60" | 7.06" | 15.04" | 15.43" | 15.34" | 14.64" | 21.96" | 16.03" | 22.99" | 10.24" | 195.64" |
| Kwajalein | 6.60" | 11.46" | 17.65" | 7.42" | 1.66" | 1.37" | 4.61" | 4.19" | 11.17" | 10.17" | 10.98" | 8.43" | 95.71" |
| Lukonor | 11.63" | 15.43" | 7.40" | 10.54" | 5.42" | 6.83" | 14.20" | 18.58" | 17.54" | 13.12" | 9.21" | 7.25" | 137.15" |
| Majuro | 6.27" | 10.98" | 13.51" | 7.96" | 4.38" | 5.11" | 1.08" | 10.43" | 15.17" | 10.92" | 8.85" | 7.14" | 101.8" |
| Pago Pago | 10.18" | 8.45" | 3.69" | 25.00" | 18.99" | 24.09" | 7.61" | 10.83" | 20.37" | 9.91" | 4.50" | 6.68" | 150.3" |
| Pohnpei | 19.57" | 12.71" | 26.39" | 7.76" | 6.65" | 16.27" | 12.02" | 21.36" | 24.07" | 15.34" | 21.09" | 7.02" | 190.25" |
| Saipan | 11.03" | 9.80" | 7.44" | 6.07" | 1.87" | 2.05" | 1.57" | 1.76" | 1.26" | 7.71" | 3.74" | 9.40" | 63.7" |
| Yap | 9.46" | 10.74" | 6.95" | 3.53" | 5.73" | 2.84" | 0.64" | 1.83" | 6.03" | 6.61" | 20.23" | 12.28" | 86.87" |
| Station Name | Sep 2023 | Oct 2023 | Nov 2023 | Dec 2023 | Jan 2024 | Feb 2024 | Mar 2024 | Apr 2024 | May 2024 | Jun 2024 | Jul 2024 | Aug 2024 | Sep- Aug |
|---|---|---|---|---|---|---|---|---|---|---|---|---|---|
| Chuuk | 11.71" | 11.51" | 10.61" | 11.25" | 10.10" | 7.25" | 8.32" | 12.47" | 11.30" | 11.66" | 11.98" | 12.86" | 136.77" |
| Guam NAS | 12.66" | 11.44" | 7.38" | 5.11" | 4.01" | 3.03" | 2.07" | 2.53" | 3.40" | 6.18" | 10.14" | 14.74" | 99.09" |
| Kapingamarangi | 9.93" | 8.19" | 9.27" | 9.84" | 9.15" | 9.27" | 11.43" | 13.64" | 12.08" | 13.78" | 14.15" | 8.13" | 145.85" |
| Koror | 11.77" | 11.84" | 11.39" | 11.16" | 10.18" | 8.56" | 7.44" | 7.32" | 11.83" | 17.48" | 18.53" | 13.50" | 152.90" |
| Kosrae | 14.22" | 10.94" | 13.83" | 16.11" | 16.67" | 12.93" | 16.06" | 17.51" | 17.75" | 14.64" | 14.91" | 14.22" | 213.87" |
| Kwajalein | 10.74" | 11.18" | 11.28" | 6.66" | 3.16" | 2.64" | 2.35" | 5.26" | 6.72" | 6.93" | 9.87" | 9.74" | 90.41" |
| Lukonor | 10.15" | 11.32" | 9.08" | 11.27" | 8.41" | 8.93" | 9.26" | 11.31" | 11.69" | 11.65" | 15.93" | 14.04" | 151.36" |
| Majuro | 11.17" | 12.73" | 13.44" | 11.39" | 7.74" | 6.88" | 6.58" | 9.42" | 10.11" | 11.01" | 11.17" | 11.69" | 125.25" |
| Pago Pago | 6.53" | 9.26" | 10.14" | 12.84" | 13.34" | 12.00" | 10.68" | 9.39" | 9.66" | 5.33" | 5.55" | 5.38" | 125.57" |
| Pohnpei | 12.55" | 15.27" | 14.83" | 16.08" | 13.18" | 9.55" | 13.17" | 18.41" | 19.96" | 14.81" | 15.43" | 14.26" | 182.36" |
| Saipan | 10.09" | 10.62" | 5.61" | 3.85" | 2.53" | 2.59" | 1.89" | 2.63" | 2.38" | 3.62" | 8.91" | 13.13" | 70.25" |
| Yap | 13.50" | 12.18" | 8.83" | 8.51" | 6.39" | 5.19" | 4.56" | 5.63" | 7.85" | 12.04" | 15.08" | 14.82" | 120.31" |
As measured by percent of normal precipitation, Airai, Lukunor, Majuro, Saipan, and Yap were drier than normal at all time scales in the short term (August and the last 3 months [June-August]) and long term (year to date [January-August] and last 12 months [September 2023-August 2024]). Guam was near normal for August but drier than normal for the other 3 time periods. Kapingamarangi and Pohnpei were drier than normal in the short term but near to wetter than normal in the long term. Chuuk was drier than normal for August and the year to date, but near to wetter than normal for the last 3 and 12 months. Kosrae was drier than normal for August and the last 12 months, but near to wetter than normal for the last 3 months and year to date. Kwajalein was drier than normal for August but near to wetter than normal for the other 3 time periods. Pago Pago was wetter than normal for all 4 time periods.


Based on percent of normal average (instead of normal median values), in the Marianas Islands, August and the last 2 to 12 months were generally drier than normal across the main islands; longer time periods had a mixed precipitation anomaly pattern with wet conditions dominating (percent of normal precipitation maps for the last 1, 2, 3, 4, 5, 6, 8, 9, 11, 12, 24, 36, 48, 60 months).


Based on percent of normal average (instead of normal median values), the Marshall Islands were mostly drier than normal in August. The last 2 to 12 months had a mixed precipitation anomaly pattern with drier-than-normal conditions dominating. Longer time periods had a mixed anomaly pattern (percent of normal precipitation maps for the last 1, 2, 3, 4, 5, 6, 8, 9, 11, 12, 24, 36, 48, 60 months).

According to the August 31 USDM produced for the USAPI:
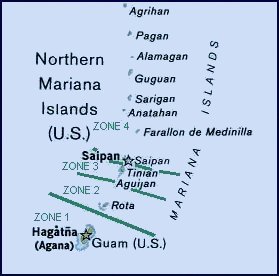
- In the Marianas, abnormal dryness ended at Saipan;
- In the FSM, moderate drought began at Kapingamarangi and abnormal dryness began at Lukunor, Nukuoro, and Pohnpei and returned to Ulithi, with two stations having insufficient data for an analysis;
- In the Marshalls, abnormal dryness developed at Jaluit, with two stations having insufficient data for an analysis; and
- Palau, American Samoa, the Marianas, and the rest of the stations in the FSM and Marshalls were free of drought and abnormal dryness.
The level of the reservoir on Majuro began the month at 32.7 million gallons, reached a peak of 33.4 million gallons on the 3rd and 4th, then steadily declined to end the month at 28.1 million gallons. If the reservoir dips below 28.8 million gallons, drought becomes a concern. In Yap State, the Gitam Reservoir on Fais Island was very low in mid-August. Satellite observations of vegetative health (drought stress, stressed vegetation, VHI) revealed a few areas of stressed vegetation remaining on Guam.
August 2024 precipitation ranks ranged from dry to mid-range, based on data available at the time of this report. Some locations have had dry conditions for several months:
- Kapingamarangi: third driest August (in a 34-year record), sixth driest July-August, and fifth driest June-August and May-August.
- Lukunor: third driest August (28 years), fourth driest July-August, and fifth driest June-August.
- Pohnpei: third driest August (74 years).
- Nukuoro: fifth driest August (41 years), third driest February-August, and ninth driest September-August.
- Ulithi: third driest August (42 years), fourth driest December-August and November-August, and fifth driest September-August.
- Airai: eighth driest August (73-year combined record).
- Jaluit: seventh driest August (41 years), fourth driest July-August, and sixth driest September-August.
- Majuro: sixth driest August (71 years), third driest July-August, and sixth driest September-August.
- Yap: 27th driest August (74 years), but sixth driest September-August.
- Saipan: 14th driest August (44 years), but eighth driest September-August.
At the wet end of the scale:
- Pago Pago had the third wettest December-August (58 years).
The following analysis of historical data for the USAPI stations in the Global Historical Climatology Network-Daily (GHCN-D) dataset, augmented with fill-in data from the 1981-2010 Normals, helps put the current data into historical perspective by computing ranks based on the period of record. The table below lists the precipitation ranks for August 2024, March-August 2024 (last 6 months), and September 2023-August 2024 (the last 12 months). Some stations have a long period of record and their dataset is fairly complete, while other stations have a shorter period of record and the dataset has some missing data.
| Station | August 2024 | Mar-Aug 2024 | Sep 2023-Aug 2024 | Period of Record | |||
|---|---|---|---|---|---|---|---|
| Rank | Years | Rank | Years | Rank | Years | ||
| Ailinglaplap | 25 | 40 | 28 | 40 | 26 | 38 | 1981-2024 |
| Airai | 8 | 73 | 20 | 72 | 26 | 72 | 1951-2024 |
| Chuuk | 15 | 74 | 26 | 73 | 26 | 73 | 1951-2024 |
| Fananu | -- | 7 | -- | 3 | -- | 3 | 2003-2023 |
| Guam | 37 | 68 | 31 | 68 | 24 | 67 | 1957-2024 |
| Jaluit | 7 | 41 | 8 | 40 | 6 | 38 | 1981-2024 |
| Kapingamarangi | 3 | 34 | 10 | 27 | 17 | 22 | 1962-2024 |
| Kosrae | 12 | 56 | 19 | 46 | 17 | 36 | 1954-2024 |
| Kwajalein | 32 | 73 | 38 | 72 | 29 | 72 | 1952-2024 |
| Lukunor | 3 | 28 | 19 | 28 | 13 | 27 | 1981-2024 |
| Majuro | 6 | 71 | 20 | 70 | 6 | 70 | 1954-2024 |
| Mili | -- | 39 | -- | 38 | -- | 35 | 1981-2024 |
| Nukuoro | 5 | 41 | 6 | 40 | 9 | 39 | 1981-2024 |
| Pago Pago | 34 | 59 | 40 | 58 | 50 | 58 | 1966-2024 |
| Pingelap | -- | 39 | -- | 38 | -- | 34 | 1981-2024 |
| Pohnpei | 3 | 74 | 37 | 73 | 40 | 73 | 1951-2024 |
| Saipan | 14 | 44 | 10 | 43 | 8 | 35 | 1981-2024 |
| Ulithi | 3 | 42 | 6 | 39 | 5 | 36 | 1981-2024 |
| Utirik | -- | 16 | -- | 7 | -- | 4 | 1985-2020 |
| Woleai | 15 | 43 | -- | 33 | -- | 28 | 1968-2024 |
| Wotje | 29 | 41 | 20 | 40 | 9 | 37 | 1981-2024 |
| Yap | 27 | 74 | 13 | 73 | 6 | 73 | 1951-2024 |


SPI values for seven time periods for Pacific Islands, computed by the Honolulu NWS office:

NOAA Regional Climate Centers
More information, provided by the NOAA Regional Climate Centers and others, can be found below.
Southeast
As noted by the Southeast Regional Climate Center, mean temperatures were variable across the Southeast in August, but they were above average across Puerto Rico and the U.S. Virgin Islands. As with temperature, August precipitation was also variable across the region, with above-average precipitation across Puerto Rico and the U.S. Virgin Islands. Much of this precipitation was connected with Hurricane Ernesto, which dropped over 10 inches (254 mm) of rain across the islands on the 14th and 15th. Below-average precipitation was found across Alabama, the western Panhandle Florida, most of Alabama, and western portions of the Carolinas, where monthly totals were less than half, and in some cases less than a quarter, of their expected amounts. Macon, GA (1892-2024) recorded its driest August on record with just 0.17 inch (4 mm), breaking the previous record of 0.70 inch (18 mm) set in 1925. Montgomery, AL (1872-2024) also recorded its driest August on record with 0.38 inch (10 mm), breaking the previous record of 0.73 inch (19 mm) set in 1997.
August began with patches of abnormal dryness (D0) across the interior of the region and pockets of moderate (D1) drought across parts of northern Alabama and the Carolinas. A small area of severe (D2) drought was also found in eastern South Carolina. Conditions were especially dry across northern Virginia, where extreme (D3) drought was found across the Shenandoah Valley and severe (D2) drought was found across parts of the Blue Ridge and Piedmont. The precipitation from Hurricane Debby helped eliminate drought and abnormal dryness across much of the Carolinas, and contributed to one-category improvements across central and northern Virginia. On the other hand, hot and dry conditions across Alabama and Georgia, as well as western portions of the Carolinas that missed out on the precipitation from Debby, led to an expansion of abnormal dryness (D0) and moderate (D1) drought, with pockets of severe (D2) drought emerging across northern portions of Alabama by the end of the month. Puerto Rico and the U.S. Virgin Islands continued to remain free of any drought or abnormal dryness.
Dry conditions across Alabama and parts of Georgia slowed the progress of many crops, particularly corn and soybeans. Many farmers were forced to rely heavily on irrigation. The lack of moisture also slowed the growth of hay fields, raising concerns that farmers may not be able to secure another cutting this season. The lack of pasture growth forced some producers to buy feed for their cattle. Dry conditions also contributed to infestations of armyworms, which caused significant damage to pastures, hayfields, and even some crops such as peanuts, which are typically resistant to such pests. On the other hand, the lack of rain helped some areas ramp up the harvest of corn and planting of fall vegetables. In parts of eastern North Carolina and northern Virginia, losses of over 60 percent were reported, as the damage from dry conditions earlier in the summer could not be fully mitigated by the recent rain.
South
As explained by the Southern Regional Climate Center, flash drought developed and intensified in much of the Southern region. Parts of all six states went from ample moisture to severe drought between July 30 and August 27, according to the USDM. August temperatures were above normal in the western portions of the Southern region, transitioning to near-normal to slightly below normal in the eastern portions. Precipitation was below normal across the majority of the Southern region during August.
As of September 3rd, 66.4 percent of the Southern region remained free of drought, down from 80.5 percent on August 6th according to the USDM. Much of the degradation was across the northern portions of the region extending from the Texas Panhandle east across Oklahoma, Arkansas, Louisiana, Mississippi, and Tennessee. Isolated areas of improvement were seen in Central and east central Oklahoma, south Texas, and western Arkansas. Persistent pockets of Extreme and Exceptional Drought remain in Far West and Central Texas, while Extreme Drought emerged in southwestern Oklahoma, Northern Mississippi, and west central Tennessee. Cotton crops in Texas and Oklahoma are still being affected by ongoing warm temperatures and drought conditions, though conditions are better than last season at this time with 23 percent of cotton in Oklahoma in Poor to Very Poor condition (56 percent less than last year) and 31 percent in Texas rated as Poor to Very Poor (30 percent less than last year). Reports of the need to haul water and provide supplemental feed are increasing across Texas and Oklahoma; however, reports are fewer than recent years at the same point in the season.
Midwest
As described by the Midwest Regional Climate Center, August monthly temperatures were largely near normal throughout the Midwest, with the regional precipitation totalling 3.39 inches (86 mm), which was 0.28 inch (7 mm) below normal, or 92 percent of normal. The average summer (June-August) regional temperature and precipitation were slightly above normal.
Drought and abnormally dry conditions expanded and intensified across the region in August, covering about 37 percent of the region by late August, according to the USDM map. The most severe conditions were focused over southeastern Ohio, where intensity reached D4 (exceptional) drought for the first time since the USDM began in the year 2000. Drought-affected areas in Ohio had poor-quality pastures, farmers were hauling water, cow/calf weaning was earlier than normal, and there was an increased risk of field fires. Elsewhere across the region, abnormally dry conditions and D1 (moderate) drought were sporadic across the region and expanding in coverage to end the month.
Northeast
As summarized by the Northeast Regional Climate Center, while August temperatures were closer to normal, the heat of June and July pushed summer into record territory (fourth hottest summer for the region), with the season also featuring extremes of record-setting drought and catastrophic flash flooding. Regional precipitation ranked 13th wettest for August but near normal for summer.
The USDM from August 6 showed 20 percent of the Northeast in drought and 17 percent of the region as abnormally dry. Drought conditions were mostly focused in the Mid-Atlantic, particularly West Virginia, western/central Maryland, and the southern half of Pennsylvania. Abnormal dryness was found in all states except Connecticut and Rhode Island. By mid-August, rainfall from the remnants of Hurricane Debby eased an area of extreme drought that spanned from eastern West Virginia into southern Pennsylvania and allowed severe and moderate drought, as well as abnormal dryness, to contract in multiple locations. The notable exceptions were southwestern Pennsylvania and West Virginia outside the Eastern Panhandle. These areas missed out on much of Debby's rainfall, allowing severe drought to expand and extreme drought to be introduced and expand in western and central West Virginia. In late August, exceptional drought was introduced in West Virginia for the first time since the inception of the USDM in 2000. The USDM from August 27 showed 15 percent of the Northeast in drought and 7 percent of the region as abnormally dry.
During August, streamflow and/or groundwater levels were much below normal or record low in parts of the Mid-Atlantic, particularly West Virginia. Low water levels in a reservoir in eastern West Virginia caused the water to be unusable due to increased iron levels. Due to this, the city had been supplying residents with bottled water for drinking, while the West Virginia Department of Transportation hauled in non-potable water for other uses. Low water levels in western Pennsylvania and West Virginia impacted recreational activities, with boat ramps out of the water, an early end to the boating season, and officials warning kayakers and boaters to be cautious of new obstacles to navigate. Despite Debby's rainfall, millions of residents in the Mid-Atlantic were asked to continue to conserve water as deficits persisted in some areas.
Farmers in parts of Pennsylvania and West Virginia continued to report reduced yields of crops like corn and soybeans as the rainfall from Debby's remnants, for those areas that received it, came too late to save the crops. A USDA crop report for the week ending August 25 showed the condition of corn, soybeans, apples, and peaches in West Virginia in the very poor, poor, and fair categories, with none in the good or excellent categories. The same crop report showed that for the first time since at least 2002 (prior records exist but are categorized differently), all of West Virginia had topsoil moisture in the very short-short categories. Additionally, for the same week, pasture and rangeland conditions were the state's worst since at least 2002. With dried up pastures and some farms not getting a second cutting of hay, growers continued to buy feed for livestock or dip into their winter supplies, with some opting to sell or relocate livestock. Farmers also continued to haul water for livestock and irrigation. All of this led to increased operational costs. There were concerns that drought conditions in West Virginia this summer could affect fall foliage, as well as crops next year and Christmas tree supplies in future years. Dried up lawns also led to reduced revenue for some landscaping businesses in West Virginia. That state also saw an uptick in wildfires over the summer due to the drought.
High Plains
As discussed by the High Plains Regional Climate Center, the heat that impacted the northwestern part of the region in July spread south during August, with nearly the entire western half of the High Plains experiencing above-normal temperatures. But August temperatures were near normal for much of the region. Aided by a prolonged stretch of heat in the West, many locations ranked in the top 5 warmest this summer.
Precipitation in August was plentiful west of the Rockies this month, with the North American Monsoon in overdrive for western Colorado and into southern Wyoming. Kansas and Nebraska were not as fortunate, with large portions of both states with below normal precipitation. Concerns about drought in western Colorado were increasing at the beginning of the month; however, monsoon rains alleviated those concerns. For summer, eastern Wyoming and western South Dakota were below 50 percent of their normal summer precipitation. Rapid City ranked 5th driest, with only 2.87 inches falling through the end of August. In Wyoming, Cody recorded less than an inch (2.54 mm) the entire summer.
Outside of the beneficial rains in Colorado and parts of Kansas, much of the region was dry and drought intensified as a result. Several states experienced a two-category degradation, while the areas that did receive rain improved by two categories. Overall, the region observed an increase of over 13 percent in D0 to D4 (abnormally dry to exceptional drought conditions). Wyoming was hit hardest this month, with extreme drought (D3) introduced and expanded in the northeastern part of the state. Large fires broke out in the state due to persistent dryness and 96 percent of the state was abnormally dry at the end of August. While parts of Kansas did see improvement, the state observed a 14 percent increase in drought conditions, and 50 percent of the state is being impacted. The north and south-central parts of the state currently have several counties in severe drought (D2), leading to concerns for winter wheat planting.
West
As summarized by the Western Regional Climate Center, August saw a return to more normal conditions after an exceptionally warm July. Most of the region saw normal temperatures, except for New Mexico, Arizona, Utah, Oregon, Washington, and Nevada. A large chunk of southern California and Nevada saw extremely dry conditions, while northern California and Utah experienced above normal precipitation totals. Drought also dramatically increased across the West with a significant wildfire threat. At the end of August/beginning of September, there were 67 active large wildfires with the most concentrated in Oregon (23) and Idaho (21).
According to the USDM at the end of August, 36 percent of the West was in drought, a 7 percent uptick from the end of July. Almost the entirety of the West is experiencing at least abnormally dry conditions (D0). Areas of extreme drought (D3) are present in southern New Mexico, northeast Wyoming, western and eastern Montana, and central Washington. Exceptional drought (D4) can be found in western Montana. The greatest drought expansion occurred in Utah and Nevada where now most of the states are in abnormally dry conditions (D0) or moderate drought (D1) with some areas even in severe drought (D2).
Alaska summary: Alaska saw mostly normal temperatures across the state, except for below normal temperatures in the Southwest and above average in the Southeast. For precipitation, the Southwest and Interior Alaska saw precipitation totals of 2 inches or more above normal. According to the USDM, one percent of Alaska is currently in drought with all of the spatial extent in the Southeast.
Hawaii summary: The island of Kauai saw near record dryness for the month of August, while Maui saw near record wetness. Lihue on the island of Kauai saw its third driest August at 0.63 inch (27 percent of normal). Kahului on the island of Maui saw its third wettest August at 1.62 inches (306 percent of normal). Drought significantly decreased across Hawaii with now only 21 percent of the state in drought. The highest level of drought present in Hawaii is severe drought (D2) in southwest Maui, central Molokai, western Oahu, and southwest Kauai.