

NOAA and its partners have released the latest Regional Climate Impacts and Outlooks, which recap summer conditions and provide insight into what might be expected this autumn.
Summer Temperature Recap
- The meteorological summer (June-August) average temperature for the Lower 48 was 73.9°F, 2.5°F above average, ranking as the third-warmest summer on record.
- Summer temperatures were above average across most of the contiguous United States. Texas, Massachusetts and Rhode Island ranked second warmest while 17 additional states across the West, South and Northeast ranked among their warmest 10 summer seasons on record.
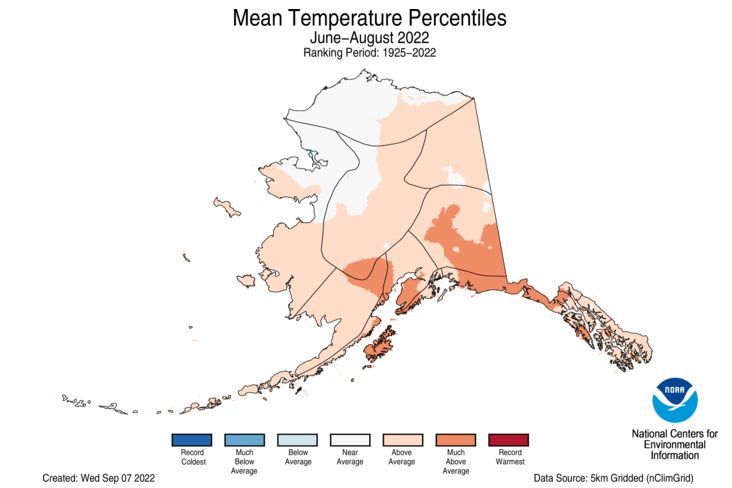
- The Alaska summer temperature was 52.1°F, 1.6°F above the long-term average, ranking in the warmest third of the record for the state. Temperatures were above average across most of the state with the Northwest and areas along the Arctic near average for the season.
- The contiguous U.S. average maximum (daytime) temperature during June-August was 86.6°F, 2.2°F above the 20th century average, ranking as the seventh warmest on record. Above-average daytime temperatures were observed across much of the contiguous U.S. Temperatures were near to or below average across portions of the Midwest, Southeast and Southwest.
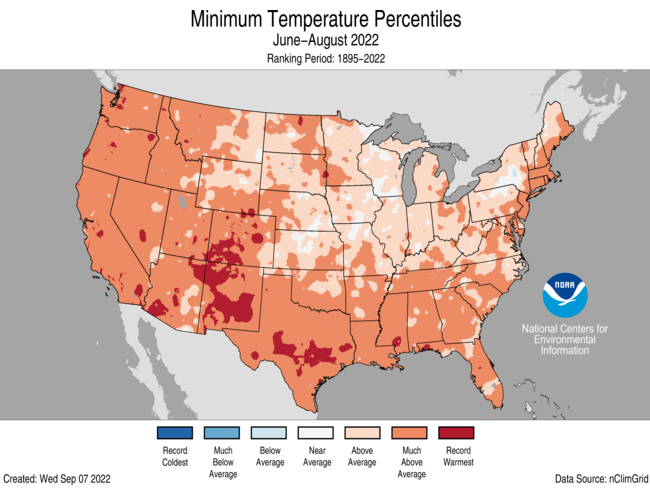
- The contiguous U.S. average minimum (nighttime) temperature during June-August was 61.2°F, 2.8°F above the 20th century average, ranking as the second warmest on record. Nighttime temperatures were above average across most of the Lower 48. Temperatures were near average in pockets across the Northeast and northern Mississippi Valley.

Autumn Temperature Outlook
The Autumn 2022 temperature outlook favors above normal temperatures for the southern two-thirds of the contiguous United States (CONUS), the eastern third of the CONUS, and northwestern Alaska. The largest probabilities (greater than 50 percent) of above normal temperatures are forecast across the Four Corners region, much of the Southwest, the Rio Grande Valley, much of the Southern Plains, the Florida Peninsula and eastern New England. Conversely, a weak tilt toward below normal temperatures is indicated for southeastern Alaska.

Summer Precipitation Recap
- The U.S. summer precipitation total was 8.18 inches, 0.14 inch below average, ranking in the middle third of the June-August record.
- Precipitation was above average along the West Coast, much of the Southwest, Midwest, lower Mississippi Valley and northern New England for the season. Precipitation during June-August was below average across the Great Plains, southern New England and other portions of the East Coast. Arizona ranked seventh wettest while Nebraska ranked third driest for the summer season.
- For the summer season, precipitation ranked in the wettest third of the record for Alaska with wetter-than-average conditions observed in the North Slope, West Coast and southern portions of the state; parts of the Northeast interior were drier than average for the season.

Autumn Precipitation Outlook
The Autumn 2022 precipitation outlook depicts enhanced probabilities of below normal precipitation amounts across the Southern Tier of the CONUS extending northward to include much of the Central Plains and Central Rockies. Above normal precipitation is more likely for the northwestern CONUS and parts of southwestern Mainland Alaska.

Impacts and Outlooks for Your Region
Get more details for your region in the September 2022 climate impacts and outlooks summaries:
- Alaska and Northwestern Canada Region
- Northeast Region
- Great Lakes Region
- Gulf of Maine Region
- Mid-Atlantic Region
- Midwest Region
- Missouri River Basin Region
- Pacific Region
- Southeast Region
- Southern Region
- Western Region
Creating These Quarterly Summaries
NOAA’s Regional Climate Services lead the production of these quarterly summaries of climate impacts and outlooks for various regions of the United States as well as parts of Canada along the border. This effort, which began in 2012, now includes as many as 11 unique regional products, all produced collaboratively with partner organizations.
You can access all of the Climate Impacts and Outlooks summaries as well as additional reports and assessments through the U.S. Drought Portal Reports web page at Drought.gov.


